Multiple Choice
Refer to Figure 10.2 for the following questions.
Figure 10.2
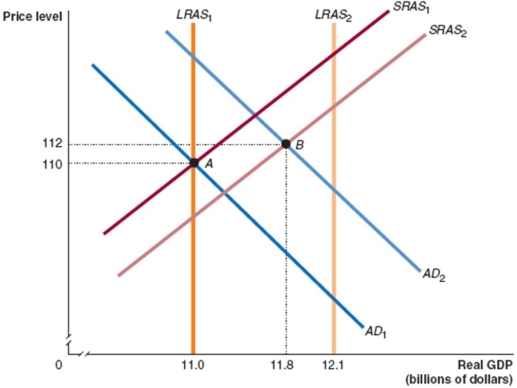
-Refer to Figure 10.2. Given the economy is at point A in year 1, what is the difference between the actual growth rate in GDP in year 2 and the potential growth rate in GDP in year 2?
A) 0.3%
B) 1.1%
C) 2.7%
D) 3.7%
Correct Answer:

Verified
Correct Answer:
Verified
Related Questions
Q51: A decrease in the price level results
Q70: What does the slope of the aggregate
Q71: Which of the following is true of
Q73: What is the result of a decrease
Q74: Which of the following is true in
Q76: Inflation is generally the result of total
Q77: Which of the following correctly describes the
Q78: The international-trade effect states that, ceteris paribus,
Q79: When the price level in Australia rises
Q80: What do the 'aggregate demand' and 'aggregate