Multiple Choice
Refer to Figure 10.2 for the following questions.
Figure 10.2
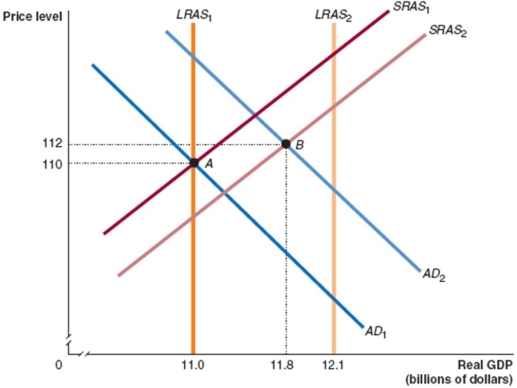
-In Figure 10.2, given the economy is at point A in year 1 and point B in year 2, what is the rate of increase in the price level (the inflation rate) between those two years?
A) 1.8%
B) 2.7%
C) 3.0%
D) 0.9%
Correct Answer:

Verified
Correct Answer:
Verified
Q24: An increase in government spending will result
Q63: _ of unemployment during _ make it
Q118: When does long-run macroeconomic equilibrium occur?<br>A)When aggregate
Q119: Which of the following is one of
Q120: Which of the following will not shift
Q124: What does the short-run aggregate supply curve
Q125: Outline and explain the factors that shift
Q126: If Australia's economic growth rate is slower
Q127: What is the result if the economy
Q128: Explain whether it is possible for a