Essay
Assume that the economy is in the state described by the following table.
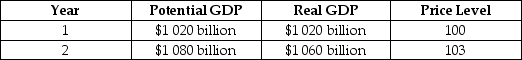
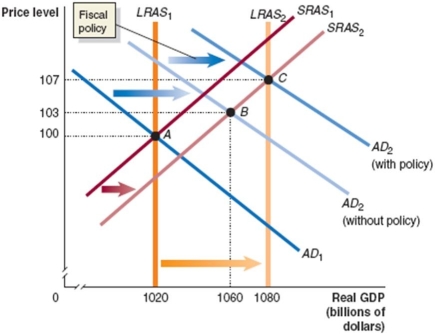
Draw a dynamic aggregate demand and aggregate supply diagram to illustrate the state of the economy in year 1 and year 2, assuming that no policy is pursued. Then illustrate the appropriate fiscal policy to use in this situation. Assume that the policy results in the economy producing at potential GDP. Provide an explanation.
_____________________________________________________________________________________________
_____________________________________________________________________________________________
Correct Answer:

Verified
The economy begins in equilibrium at poi...View Answer
Unlock this answer now
Get Access to more Verified Answers free of charge
Correct Answer:
Verified
View Answer
Unlock this answer now
Get Access to more Verified Answers free of charge
Q35: What did Milton Friedman and Edmund Phelps
Q36: The structural budget deficit indicates what the
Q37: Short-run resource crowding out is likely to
Q38: Both Milton Friedman and Edmund Phelps argued
Q39: The government purchases multiplier will be larger
Q41: An equal decrease in government purchases and
Q42: If a(n)_ in government purchases leads to
Q43: If policy makers implement expansionary fiscal policy
Q45: Suppose that the nominal wage, the expected
Q285: In the case of an upward-sloping aggregate