Multiple Choice
Refer to Figure 15.2 for the following questions.
Figure 15.2
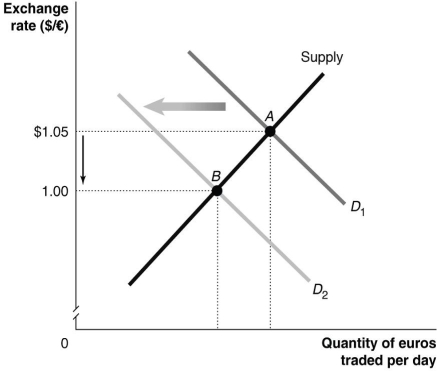
-Which of the following would cause the change depicted in Figure 15.2? Note that the figure depicts the quantity of euros traded.
A) Australian productivity falls relative to European productivity.
B) Australians decrease their preferences for goods produced in the European Union (EU) relative to Australian goods.
C) The EU increases its quotas on Italian wine.
D) The price level of goods produced in the EU decreases relative to the price level of goods produced in Australia.
Correct Answer:

Verified
Correct Answer:
Verified
Q4: What determined the exchange rates among currencies
Q37: What are capital controls? Why might a
Q86: All of the following explain why purchasing
Q88: Refer to Figure 15.3 for the following
Q89: When the value of a currency is
Q90: Most economists have argued that in the
Q94: If foreign investment in Australian assets increased,
Q95: If the rate of productivity growth in
Q96: Suppose a tablet computer costs $200 in
Q97: Which of the following was not a