Multiple Choice
Refer to Figure 15.2 for the following questions.
Figure 15.2
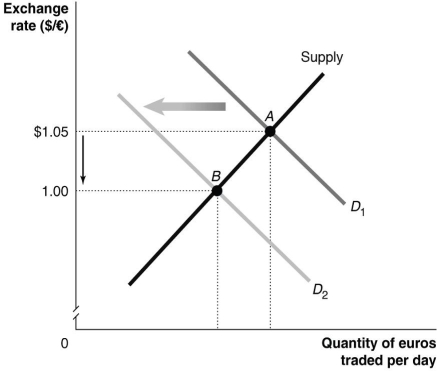
-Which of the following would cause the change depicted in Figure 15.2? Note that the figure depicts the quantity of euros traded.
A) European productivity rises relative to Australian productivity.
B) Japanese decrease their preferences for goods produced in the EU relative to Australian goods.
C) The European Union increases its quotas on German wrist watches.
D) The price level of goods produced in the EU increases relative to the price level of goods produced in Australia.
Correct Answer:

Verified
Correct Answer:
Verified
Q36: Under a floating exchange rate,the exchange rate<br>A)will
Q123: Has the adoption of the euro by
Q124: Would we expect that purchasing power parity
Q125: A 'floating exchange rate system' is one
Q126: The three most important financial centres in
Q128: A currency exchange rate system under which
Q129: In a pegged exchange rate system, a
Q130: Soon after the Australia dollar was floated,
Q131: If the Thai baht is pegged above
Q132: Both countries involved in an exchange rate