Multiple Choice
Figure 1.1
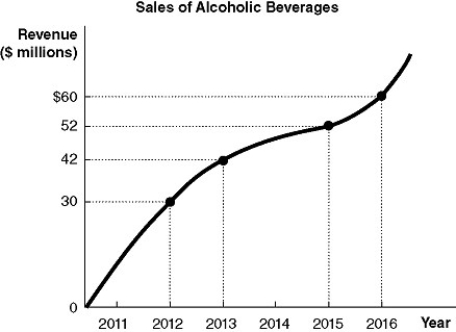
-Refer to Figure 1-1.Using the information in the figure above, calculate the percentage change in revenue from alcoholic beverage sales between 2013 and 2016.
A) 23.1%
B) 23.8%
C) 30%
D) 42.9%
Correct Answer:

Verified
Correct Answer:
Verified
Q12: Economic models do all of the following
Q13: Which of the following statements about economic
Q14: The decision about what goods and services
Q15: The town of Harmonia gives away all
Q16: The additional cost to a producer of
Q18: In economics, the term _ refers to
Q19: Scenario 1-1<br>Suppose a cell phone manufacturer currently
Q20: Pookie's Pinball Palace restores old Pinball machines.Pookie
Q21: Table 1-1<br> <img src="https://d2lvgg3v3hfg70.cloudfront.net/TB4193/.jpg" alt="Table 1-1
Q22: The sales revenue a seller receives from