Multiple Choice
Figure 1.1
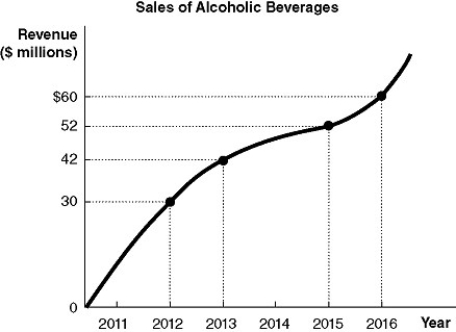
-Refer to Figure 1-1.Using the information in the figure above, calculate the percentage change in revenue from alcoholic beverage sales between 2012 and 2016.
A) 30%
B) 50%
C) 66.7%
D) 100%
Correct Answer:

Verified
Correct Answer:
Verified
Related Questions
Q4: The Coffee Nook, a small cafe near
Q5: Optimal decisions are made at the point
Q6: Suppose that to increase sales of hybrid
Q7: Which of the following is a positive
Q8: In the market for factors of production,
Q10: Mr.Peabody chooses to invest in companies that
Q11: What is the difference between an invention
Q12: Economic models do all of the following
Q13: Which of the following statements about economic
Q14: The decision about what goods and services