Multiple Choice
Figure 2-4
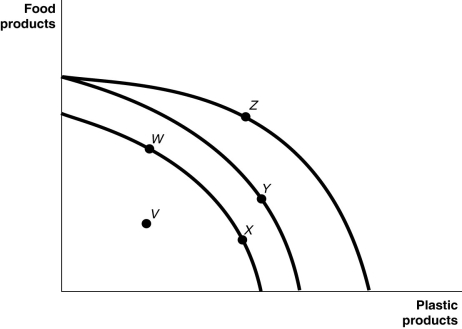
Figure 2-4 shows various points on three different production possibilities frontiers for a nation.
-Refer to Figure 2-4.Consider the following events:
A.a decrease in the unemployment rate
B.an increase in a nation's money supply
C.an influx of immigrant workers
Which of the events listed above could cause a movement from X to Z?
A) a, b, and c
B) a and b only
C) a and c only
D) a only
E) c only
Correct Answer:

Verified
Correct Answer:
Verified
Q115: Increasing opportunity cost is represented by a
Q116: Table 2-7<br> <img src="https://d2lvgg3v3hfg70.cloudfront.net/TB4193/.jpg" alt="Table 2-7
Q117: Table 2-11<br> <img src="https://d2lvgg3v3hfg70.cloudfront.net/TB4193/.jpg" alt="Table 2-11
Q118: Suppose that in Germany, the opportunity cost
Q119: For each bottle of wine that Italy
Q121: What is a circular flow diagram and
Q122: Figure 2-8<br> <img src="https://d2lvgg3v3hfg70.cloudfront.net/TB4193/.jpg" alt="Figure 2-8
Q123: a.Draw a production possibilities frontier for a
Q124: _ marginal opportunity cost implies that the
Q125: Figure 2-9<br> <img src="https://d2lvgg3v3hfg70.cloudfront.net/TB4193/.jpg" alt="Figure 2-9