Multiple Choice
Figure 3-2
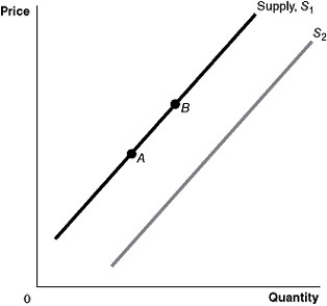
-Refer to Figure 3-2.An increase in the number of firms in the market would be represented by a movement from
A) A to B.
B) B to A.
C) S₁ to S₂.
D) S₂ to S₁.
Correct Answer:

Verified
Correct Answer:
Verified
Q106: Figure 3-5<br> <img src="https://d2lvgg3v3hfg70.cloudfront.net/TB4193/.jpg" alt="Figure 3-5
Q107: A supply schedule<br>A)is a table that shows
Q108: Table 3-1<br> <img src="https://d2lvgg3v3hfg70.cloudfront.net/TB4193/.jpg" alt="Table 3-1
Q109: "Because apples and oranges are substitutes, an
Q110: Figure 3-7<br> <img src="https://d2lvgg3v3hfg70.cloudfront.net/TB4193/.jpg" alt="Figure 3-7
Q112: An increase in the price of off-road
Q113: Technological advancements have led to lower prices
Q114: Draw a supply and demand graph showing
Q115: Table 3-3<br> <img src="https://d2lvgg3v3hfg70.cloudfront.net/TB4193/.jpg" alt="Table 3-3
Q116: Figure 3-8<br> <img src="https://d2lvgg3v3hfg70.cloudfront.net/TB4193/.jpg" alt="Figure 3-8