Multiple Choice
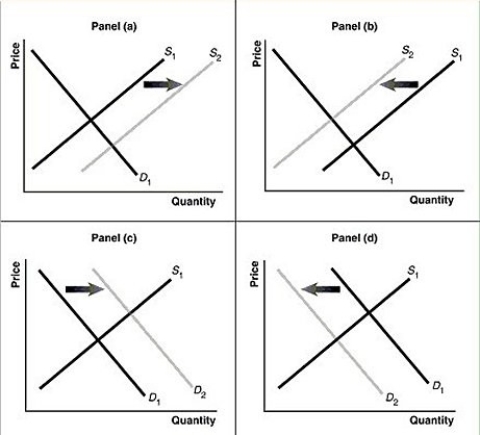
Figure 3-7

-Refer to Figure 3-7.Assume that the graphs in this figure represent the demand and supply curves for used clothing, an inferior good.Which panel describes what happens in this market as a result of a decrease in income?
A) Panel (a)
B) Panel (b)
C) Panel (c)
D) Panel (d)
Correct Answer:

Verified
Correct Answer:
Verified
Q84: Nearly one-fifth of China's 1.38 billion people
Q85: Let D = demand, S = supply,
Q86: Table 3-2<br> <img src="https://d2lvgg3v3hfg70.cloudfront.net/TB4193/.jpg" alt="Table 3-2
Q87: If the price of music downloads was
Q88: A(n)_ is represented by a leftward shift
Q90: If the price of refillable butane lighters
Q91: Table 3-1<br> <img src="https://d2lvgg3v3hfg70.cloudfront.net/TB4193/.jpg" alt="Table 3-1
Q92: A decrease in the demand for soft
Q93: Elvira decreased her consumption of bananas when
Q94: Explain the differences between a change in