Multiple Choice
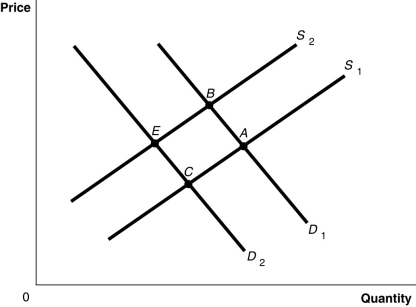
Figure 3-8

-Refer to Figure 3-8.The graph in this figure illustrates an initial competitive equilibrium in the market for sugar at the intersection of D₁ and S₂ (point B) . If there is a decrease in the price of fertilizer used on sugar cane and there is a decrease in tastes for sugar-sweetened soft drinks, how will the equilibrium point change?
A) The equilibrium point will move from B to A.
B) The equilibrium point will move from B to C.
C) There will be no change in the equilibrium point.
D) The equilibrium point will move from B to E.
Correct Answer:

Verified
Correct Answer:
Verified
Q69: If an increase in income leads to
Q70: By drawing a demand curve with _
Q71: Vineyards can grow either red wine grapes
Q72: All else equal, as the price of
Q73: An increase in the quantity of a
Q75: Olive oil producers want to sell more
Q76: Which of the following would shift the
Q77: Figure 3-4<br> <img src="https://d2lvgg3v3hfg70.cloudfront.net/TB4193/.jpg" alt="Figure 3-4
Q78: From a supply perspective, what impact would
Q79: An increase in the number of firms