Multiple Choice
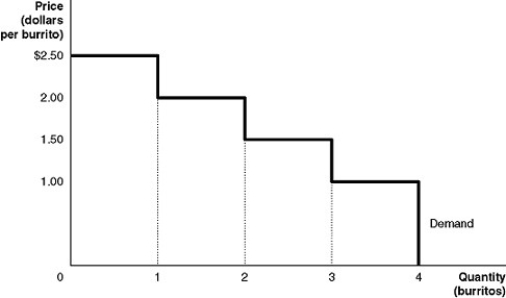
Figure 4-1

Figure 4-1 shows Arnold's demand curve for burritos.
-Refer to Figure 4-1.Arnold's marginal benefit from consuming the fourth burrito is
A) $0.
B) $1.00.
C) $2.50.
D) $3.00.
Correct Answer:

Verified
Correct Answer:
Verified
Q172: The sum of consumer surplus and producer
Q173: Economic efficiency is a market outcome in
Q174: Table 4-5<br> <img src="https://d2lvgg3v3hfg70.cloudfront.net/TB4193/.jpg" alt="Table 4-5
Q175: Figure 4-1<br> <img src="https://d2lvgg3v3hfg70.cloudfront.net/TB4193/.jpg" alt="Figure 4-1
Q176: The government proposes a tax on imported
Q178: Figure 4-8<br> <img src="https://d2lvgg3v3hfg70.cloudfront.net/TB4193/.jpg" alt="Figure 4-8
Q179: Which of the following statements best describes
Q180: Table 4-7<br> <img src="https://d2lvgg3v3hfg70.cloudfront.net/TB4193/.jpg" alt="Table 4-7
Q181: Figure 4-1<br> <img src="https://d2lvgg3v3hfg70.cloudfront.net/TB4193/.jpg" alt="Figure 4-1
Q182: Figure 4-4<br> <img src="https://d2lvgg3v3hfg70.cloudfront.net/TB4193/.jpg" alt="Figure 4-4