menu-iconExamlexExamLexServices

Discover

Ask a Question
  1. All Topics
  2. Topic
    Business
  3. Study Set
    Microeconomics Study Set 2
  4. Exam
    Exam 4: Economic Efficiency, Government Price Setting, and Taxes
  5. Question
    Figure 4-1 Figure 4-1 Shows Arnold's Demand Curve for Burritos
Solved

Figure 4-1 Figure 4-1 Shows Arnold's Demand Curve for Burritos

Question 8

Question 8

Multiple Choice

Figure 4-1
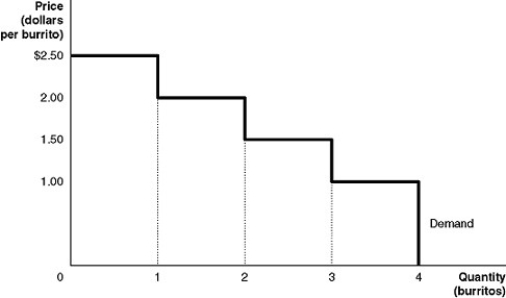
Figure 4-1     Figure 4-1 shows Arnold's demand curve for burritos. -Refer to Figure 4-1.If the market price is $1.00, what is the consumer surplus on the third burrito? A) $0.50 B) $1.00 C) $1.50 D) $7.50
Figure 4-1 shows Arnold's demand curve for burritos.
-Refer to Figure 4-1.If the market price is $1.00, what is the consumer surplus on the third burrito?


A) $0.50
B) $1.00
C) $1.50
D) $7.50

Correct Answer:

verifed

Verified

Unlock this answer now
Get Access to more Verified Answers free of charge

Related Questions

Q3: Figure 4-5<br> <img src="https://d2lvgg3v3hfg70.cloudfront.net/TB4193/.jpg" alt="Figure 4-5

Q4: In a competitive market, the demand curve

Q5: Table 4-2<br> <img src="https://d2lvgg3v3hfg70.cloudfront.net/TB4193/.jpg" alt="Table 4-2

Q6: Table 4-7<br> <img src="https://d2lvgg3v3hfg70.cloudfront.net/TB4193/.jpg" alt="Table 4-7

Q7: David Card and Alan Krueger conducted a

Q9: Figure 4-1<br> <img src="https://d2lvgg3v3hfg70.cloudfront.net/TB4193/.jpg" alt="Figure 4-1

Q10: Economists have shown that the burden of

Q11: Frieda is at her local florist to

Q12: The marginal cost for Java Joe's to

Q13: The cities of Francistown and Nalady are

Examlex

ExamLex

About UsContact UsPerks CenterHomeschoolingTest Prep

Work With Us

Campus RepresentativeInfluencers

Links

FaqPricingChrome Extension

Download The App

Get App StoreGet Google Play

Policies

Privacy PolicyTerms of ServiceHonor CodeCommunity Guidelines

Scan To Download

qr-code

Copyright © (2025) ExamLex LLC.

Privacy PolicyTerms Of ServiceHonor CodeCommunity Guidelines