Multiple Choice
Figure 4-3
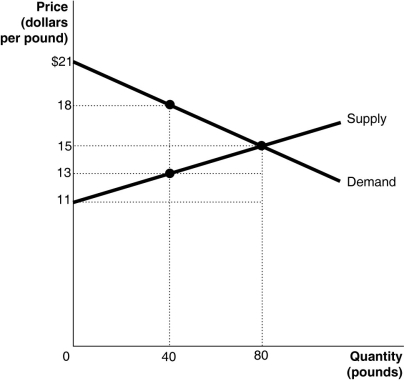
Figure 4-3 shows the market for tiger shrimp. The market is initially in equilibrium at a price of $15 and a quantity of 80. Now suppose producers decide to cut output to 40 in order to raise the price to $18.
-Refer to Figure 4-3.At the equilibrium price of $15 consumers are willing to buy 80 pounds of tiger shrimp.Is this an economically efficient quantity?
A) No, the marginal benefit of the 80th unit exceeds the marginal cost of the 80th unit.
B) Yes, because marginal cost is zero at the 80th unit.
C) Yes, because $15 is the price where the marginal benefit is equal to the marginal cost.
D) No, the marginal cost of the 80th unit exceeds the marginal benefit of the 80th unit.
Correct Answer:

Verified
Correct Answer:
Verified
Q154: _ is maximized in a competitive market
Q155: Suppose the demand curve for a product
Q156: Table 4-4<br> <img src="https://d2lvgg3v3hfg70.cloudfront.net/TB4193/.jpg" alt="Table 4-4
Q157: Figure 4-5<br> <img src="https://d2lvgg3v3hfg70.cloudfront.net/TB4193/.jpg" alt="Figure 4-5
Q158: Table 4-4<br> <img src="https://d2lvgg3v3hfg70.cloudfront.net/TB4193/.jpg" alt="Table 4-4
Q160: A _ curve shows the marginal cost
Q161: Figure 4-5<br> <img src="https://d2lvgg3v3hfg70.cloudfront.net/TB4193/.jpg" alt="Figure 4-5
Q162: The actual division of the burden of
Q163: Table 4-6<br> <img src="https://d2lvgg3v3hfg70.cloudfront.net/TB4193/.jpg" alt="Table 4-6
Q164: Figure 4-5<br> <img src="https://d2lvgg3v3hfg70.cloudfront.net/TB4193/.jpg" alt="Figure 4-5