Multiple Choice
Table 4-4
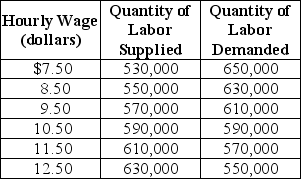
Table 4-4 shows the demand and supply schedules for the labor market in the city of Pixley.
-Refer to Table 4-4.Suppose that the quantity of labor demanded increases by 40,000 at each wage level.What are the new free market equilibrium hourly wage and the new equilibrium quantity of labor?
A) W = $8.50; Q = 550,000
B) W = $12.50; Q = 630,000
C) W = $9.50; Q = 570,000
D) W = $11.50; Q = 610,000
Correct Answer:

Verified
Correct Answer:
Verified
Q84: If Uber is required to start paying
Q85: Figure 4-1<br> <img src="https://d2lvgg3v3hfg70.cloudfront.net/TB4193/.jpg" alt="Figure 4-1
Q86: In the economic sense, almost everything is
Q87: In Venezuela, the government has implemented price
Q88: What do economists mean by an efficient
Q90: The area _ the market supply curve
Q91: Shortage means the same thing as scarcity.
Q92: Figure 4-8<br> <img src="https://d2lvgg3v3hfg70.cloudfront.net/TB4193/.jpg" alt="Figure 4-8
Q93: In cities with rent controls, the actual
Q94: Figure 4-1<br> <img src="https://d2lvgg3v3hfg70.cloudfront.net/TB4193/.jpg" alt="Figure 4-1