Multiple Choice
Table 4-4
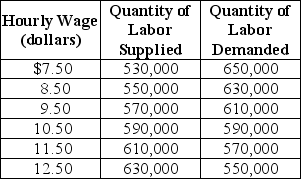
Table 4-4 shows the demand and supply schedules for the labor market in the city of Pixley.
-Refer to Table 4-4.Suppose that the quantity of labor supplied increases by 40,000 at each wage level.What are the new free market equilibrium hourly wage and the new equilibrium quantity of labor?
A) W = $8.50; Q = 550,000
B) W = $12.50; Q = 630,000
C) W = $9.50; Q = 610,000
D) W = $11.50; Q = 610,000
Correct Answer:

Verified
Correct Answer:
Verified
Q178: Figure 4-8<br> <img src="https://d2lvgg3v3hfg70.cloudfront.net/TB4193/.jpg" alt="Figure 4-8
Q179: Which of the following statements best describes
Q180: Table 4-7<br> <img src="https://d2lvgg3v3hfg70.cloudfront.net/TB4193/.jpg" alt="Table 4-7
Q181: Figure 4-1<br> <img src="https://d2lvgg3v3hfg70.cloudfront.net/TB4193/.jpg" alt="Figure 4-1
Q182: Figure 4-4<br> <img src="https://d2lvgg3v3hfg70.cloudfront.net/TB4193/.jpg" alt="Figure 4-4
Q184: Table 4-3<br> <img src="https://d2lvgg3v3hfg70.cloudfront.net/TB4193/.jpg" alt="Table 4-3
Q185: Table 4-4<br> <img src="https://d2lvgg3v3hfg70.cloudfront.net/TB4193/.jpg" alt="Table 4-4
Q186: If, in a competitive market, marginal benefit
Q187: Arthur buys a new cell phone for
Q188: You are given the following market data