Multiple Choice
Table 4-4
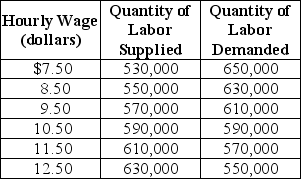
Table 4-4 shows the demand and supply schedules for the labor market in the city of Pixley.
-Refer to Table 4-4.Suppose that the quantity of labor supplied decreases by 80,000 at each wage level.What are the new free market equilibrium hourly wage and the new equilibrium quantity of labor?
A) W = $8.50; Q = 550,000
B) W = $12.50; Q = 550,000
C) W = $8.50; Q = 630,000
D) W = $11.50; Q = 610,000
Correct Answer:

Verified
Correct Answer:
Verified
Q14: What is "tax incidence"? What determines tax
Q15: The total amount of producer surplus in
Q16: Figure 4-4<br> <img src="https://d2lvgg3v3hfg70.cloudfront.net/TB4193/.jpg" alt="Figure 4-4
Q17: Figure 4-1<br> <img src="https://d2lvgg3v3hfg70.cloudfront.net/TB4193/.jpg" alt="Figure 4-1
Q18: Table 4-1<br> <img src="https://d2lvgg3v3hfg70.cloudfront.net/TB4193/.jpg" alt="Table 4-1
Q20: Figure 4-3<br> <img src="https://d2lvgg3v3hfg70.cloudfront.net/TB4193/.jpg" alt="Figure 4-3
Q21: The excess burden of a tax is
Q22: The minimum wage is an example of
Q23: Which of the following is not a
Q24: Figure 4-5<br> <img src="https://d2lvgg3v3hfg70.cloudfront.net/TB4193/.jpg" alt="Figure 4-5