Multiple Choice
Figure 4-6
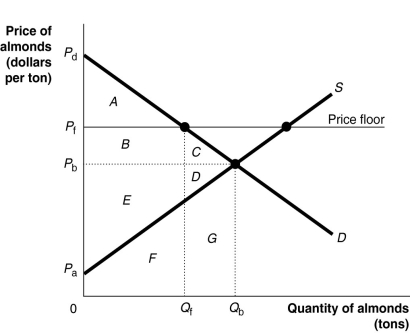
Figure 4-6 shows the demand and supply curves for the almond market. The government believes that the equilibrium price is too low and tries to help almond growers by setting a price floor at Pf.
-Refer to Figure 4-6.What area represents consumer surplus after the imposition of the price floor?
A) A + B + E
B) A + B
C) A + B + E + F
D) A
Correct Answer:

Verified
Correct Answer:
Verified
Q93: In cities with rent controls, the actual
Q94: Figure 4-1<br> <img src="https://d2lvgg3v3hfg70.cloudfront.net/TB4193/.jpg" alt="Figure 4-1
Q95: Table 4-4<br> <img src="https://d2lvgg3v3hfg70.cloudfront.net/TB4193/.jpg" alt="Table 4-4
Q96: The total amount of producer surplus in
Q97: Government intervention in agricultural markets in the
Q99: Figure 4-1<br> <img src="https://d2lvgg3v3hfg70.cloudfront.net/TB4193/.jpg" alt="Figure 4-1
Q100: Figure 4-4<br> <img src="https://d2lvgg3v3hfg70.cloudfront.net/TB4193/.jpg" alt="Figure 4-4
Q101: The following equations represent the demand and
Q102: Lucinda buys a new GPS system for
Q103: A price ceiling is a legally determined