Multiple Choice
Figure 4-6
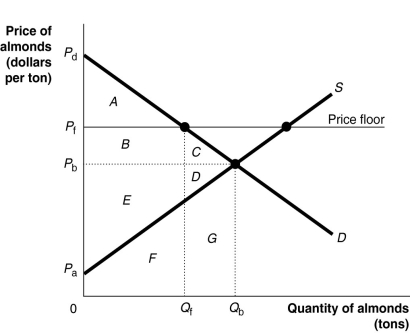
Figure 4-6 shows the demand and supply curves for the almond market. The government believes that the equilibrium price is too low and tries to help almond growers by setting a price floor at Pf.
-Refer to Figure 4-6.What area represents the deadweight loss after the imposition of the price floor?
A) C + D + G
B) F + G
C) C + D
D) C + D + F + G
Correct Answer:

Verified
Correct Answer:
Verified
Q77: Figure 4-1<br> <img src="https://d2lvgg3v3hfg70.cloudfront.net/TB4193/.jpg" alt="Figure 4-1
Q78: If the quantity of soccer balls demanded
Q79: Table 4-4<br> <img src="https://d2lvgg3v3hfg70.cloudfront.net/TB4193/.jpg" alt="Table 4-4
Q80: Suppose the demand curve for a product
Q81: Economists refer a to a market where
Q83: Marginal benefit is the total benefit to
Q84: If Uber is required to start paying
Q85: Figure 4-1<br> <img src="https://d2lvgg3v3hfg70.cloudfront.net/TB4193/.jpg" alt="Figure 4-1
Q86: In the economic sense, almost everything is
Q87: In Venezuela, the government has implemented price