Essay
Figure 4-11
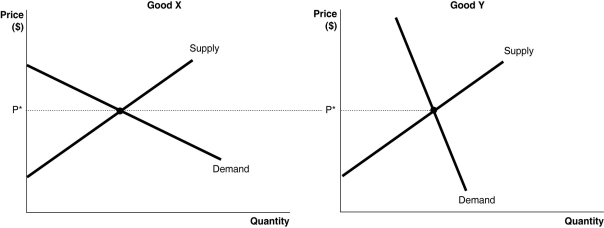
-Refer to Figure 4-11.The figure above illustrates the markets for two goods, Good X and Good Y.Suppose an identical dollar tax is imposed on sellers in each market.
a.Compare the consumer burden and producer burden in each market.Illustrate your answer graphically.
b.If the goal of the government is to raise revenue with minimum impact to quantity consumed, in which market should the tax be imposed?
c.If the goal of the government is to discourage consumption, in which market should the tax be imposed?
Correct Answer:

Verified
a.See the figures be...View Answer
Unlock this answer now
Get Access to more Verified Answers free of charge
Correct Answer:
Verified
View Answer
Unlock this answer now
Get Access to more Verified Answers free of charge
Q27: Each point on a _ curve shows
Q28: If the demand curve for a product
Q29: Figure 4-2<br> <img src="https://d2lvgg3v3hfg70.cloudfront.net/TB4193/.jpg" alt="Figure 4-2
Q30: Suppose a binding price floor on sparkling
Q31: Figure 4-5<br> <img src="https://d2lvgg3v3hfg70.cloudfront.net/TB4193/.jpg" alt="Figure 4-5
Q33: Economists are reluctant to state that price
Q34: Black markets only exist in developing nations.
Q35: Figure 4-8<br> <img src="https://d2lvgg3v3hfg70.cloudfront.net/TB4193/.jpg" alt="Figure 4-8
Q36: What is the difference between scarcity and
Q37: Congress passed the _ in 1996, the