Essay
Figure 4-12
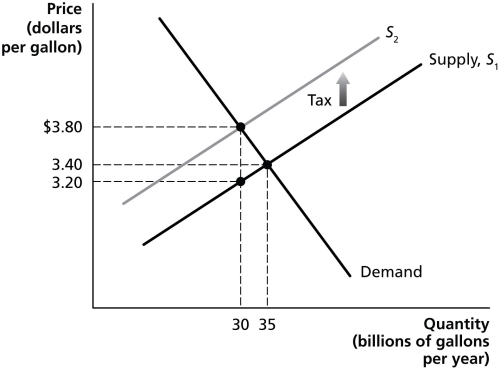
-Refer to Figure 4-12.The figure above represents demand and supply in the market for gasoline.Use the diagram to answer the following questions.
a.How much is the government tax on each gallon of gasoline?
b.What portion of the per-unit tax is paid by consumers?
c.What portion of the per-unit tax is paid by producers?
d.What is the quantity sold after the imposition of the tax?
e.What is the after-tax revenue per gallon received by producers?
f.What is the total tax revenue collected by the government?
g.What is the value of the excess burden of the tax?
Correct Answer:

Verified
a.Tax = $0.60 per gallon
b.Consumer burd...View Answer
Unlock this answer now
Get Access to more Verified Answers free of charge
Correct Answer:
Verified
b.Consumer burd...
View Answer
Unlock this answer now
Get Access to more Verified Answers free of charge
Q43: Table 4-3<br> <img src="https://d2lvgg3v3hfg70.cloudfront.net/TB4193/.jpg" alt="Table 4-3
Q44: The graph below represents the market for
Q45: Table 4-7<br> <img src="https://d2lvgg3v3hfg70.cloudfront.net/TB4193/.jpg" alt="Table 4-7
Q46: Suppliers will be willing to supply a
Q47: Figure 4-1<br> <img src="https://d2lvgg3v3hfg70.cloudfront.net/TB4193/.jpg" alt="Figure 4-1
Q49: If the price of hairspray is represented
Q50: Figure 4-8<br> <img src="https://d2lvgg3v3hfg70.cloudfront.net/TB4193/.jpg" alt="Figure 4-8
Q51: Will equilibrium in a market always result
Q52: Consumer surplus in a market for a
Q53: Figure 4-3<br> <img src="https://d2lvgg3v3hfg70.cloudfront.net/TB4193/.jpg" alt="Figure 4-3