Multiple Choice
Figure 5-1
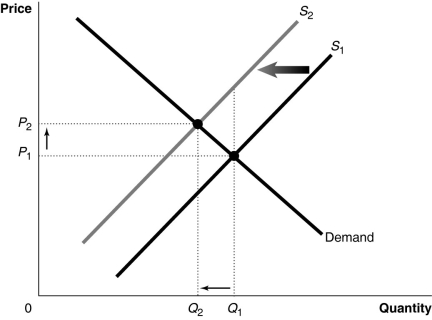
Figure 5-1 shows a market with an externality. The current market equilibrium output of Q₁ is not the economically efficient output. The economically efficient output is Q₂.
-Refer to Figure 5-1.Suppose the current market equilibrium output of Q₁ is not the economically efficient output because of an externality.The economically efficient output is Q₂.In that case, the diagram shows
A) the effect of a positive externality in the production of a good.
B) the effect of a negative externality in the production of a good.
C) the effect of an external cost imposed on a producer.
D) the effect of an external benefit such as a subsidy granted to consumers of a good.
Correct Answer:

Verified
Correct Answer:
Verified
Q241: If the marginal benefit of reducing emissions
Q242: Anyone can purchase sulfur dioxide emission allowances
Q243: Figure 5-4<br> <img src="https://d2lvgg3v3hfg70.cloudfront.net/TB4193/.jpg" alt="Figure 5-4
Q244: Haiti was once a heavily forested country.Today,
Q245: The Coase theorem asserts that government intervention
Q247: How does the construction of a market
Q248: Governments can increase the consumption of a
Q249: If the paint on your house was
Q250: Which of the following is an example
Q251: Figure 5-6<br> <img src="https://d2lvgg3v3hfg70.cloudfront.net/TB4193/.jpg" alt="Figure 5-6