Multiple Choice
Figure 5-4
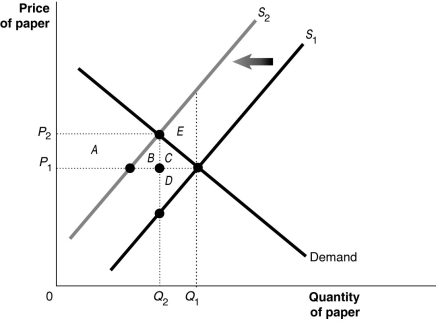
Suppose there are several paper mills producing paper for a market. These mills, located upstream from a fishing village, discharge a large amount of wastewater into the river. The waste material affects the number of fish in the river and the use of the river for recreation and as a public water supply source. Figure 5-4 shows the paper market. Use this Figure to answer the following question(s) .
-Refer to Figure 5-4.What does S₂ represent?
A) the market supply curve that reflects social cost
B) the market supply curve that reflect private cost
C) the market supply curve that reflects external cost
D) the market supply curve that reflects social benefit
Correct Answer:

Verified
Correct Answer:
Verified
Q37: Negative externalities and the tragedy of the
Q38: Worldwide annual carbon dioxide emissions increased from
Q39: Which of the following displays rivalry and
Q40: When there is a positive externality,<br>A)the marginal
Q41: Some environmentalists have criticized tradable emission allowances
Q43: Figure 5-3<br> <img src="https://d2lvgg3v3hfg70.cloudfront.net/TB4193/.jpg" alt="Figure 5-3
Q44: Figure 5-3<br> <img src="https://d2lvgg3v3hfg70.cloudfront.net/TB4193/.jpg" alt="Figure 5-3
Q45: Conceptually, the efficient level of carbon emissions
Q46: Figure 5-7<br> <img src="https://d2lvgg3v3hfg70.cloudfront.net/TB4193/.jpg" alt="Figure 5-7
Q47: Economists Kenneth Chay and Michael Greenstone found