Multiple Choice
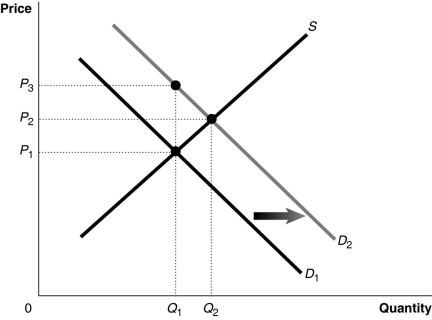
Figure 5-5

Figure 5-5 shows a market with an externality. The current market equilibrium output of Q₁ is not the economically efficient output. The economically efficient output is Q₂.
-Refer to Figure 5-5.Suppose the current market equilibrium output of Q₁ is not the economically efficient output because of an externality.The economically efficient output is Q₂.In that case, diagram shows
A) the effect of a subsidy granted to producers of a good.
B) the effect of an excess demand in a market.
C) the effect of a positive externality in the consumption of a good.
D) the effect of a negative externality in the consumption of a good.
Correct Answer:

Verified
Correct Answer:
Verified
Q225: If the United States and other developed
Q226: Which of the following is an example
Q227: An externality is an example of a
Q228: A carbon tax which is designed to
Q229: Figure 5-7<br> <img src="https://d2lvgg3v3hfg70.cloudfront.net/TB4193/.jpg" alt="Figure 5-7
Q231: Figure 5-8<br> <img src="https://d2lvgg3v3hfg70.cloudfront.net/TB4193/.jpg" alt="Figure 5-8
Q232: If there is pollution in producing a
Q233: Figure 5-4<br> <img src="https://d2lvgg3v3hfg70.cloudfront.net/TB4193/.jpg" alt="Figure 5-4
Q234: Determine if each of the products below
Q235: Figure 5-8<br> <img src="https://d2lvgg3v3hfg70.cloudfront.net/TB4193/.jpg" alt="Figure 5-8