Multiple Choice
Figure 5-6
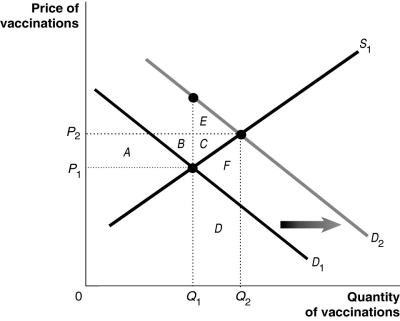
Figure 5-6 shows the market for measles vaccinations, a product whose use generates positive externalities.
-Refer to Figure 5-6.What does D₁ represent?
A) the demand curve reflecting social benefits
B) the positive externalities curve
C) the demand curve reflecting private benefits
D) the social welfare curve
Correct Answer:

Verified
Correct Answer:
Verified
Q74: Figure 5-13<br> <img src="https://d2lvgg3v3hfg70.cloudfront.net/TB4193/.jpg" alt="Figure 5-13
Q75: One difference between the demand for a
Q76: If the social cost of producing a
Q77: All of the following are examples of
Q78: Which of the following must be present
Q80: What are transactions costs? Why do transactions
Q81: Figure 5-9<br> <img src="https://d2lvgg3v3hfg70.cloudfront.net/TB4193/.jpg" alt="Figure 5-9
Q82: Figure 5-9<br> <img src="https://d2lvgg3v3hfg70.cloudfront.net/TB4193/.jpg" alt="Figure 5-9
Q83: When the federal government orders firms to
Q84: What is a private cost of production?