Multiple Choice
Figure 5-6
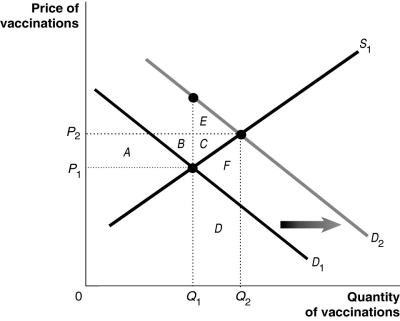
Figure 5-6 shows the market for measles vaccinations, a product whose use generates positive externalities.
-Refer to Figure 5-6.What does D₂ represent?
A) the social welfare curve
B) the demand curve reflecting marginal social benefits
C) the demand curve reflecting marginal private benefits
D) the positive externalities curve
Correct Answer:

Verified
Correct Answer:
Verified
Q171: Figure 5-3<br> <img src="https://d2lvgg3v3hfg70.cloudfront.net/TB4193/.jpg" alt="Figure 5-3
Q172: Figure 5-9<br> <img src="https://d2lvgg3v3hfg70.cloudfront.net/TB4193/.jpg" alt="Figure 5-9
Q173: When there is a negative externality, the
Q174: Figure 5-13<br> <img src="https://d2lvgg3v3hfg70.cloudfront.net/TB4193/.jpg" alt="Figure 5-13
Q175: Private producers have no incentive to provide
Q177: Medical research that results in a cure
Q178: Figure 5-13<br> <img src="https://d2lvgg3v3hfg70.cloudfront.net/TB4193/.jpg" alt="Figure 5-13
Q179: Which of the following is a source
Q180: The supply curve of a public good
Q181: Economist A.C.Pigou argued that to deal with