Multiple Choice
Figure 5-13
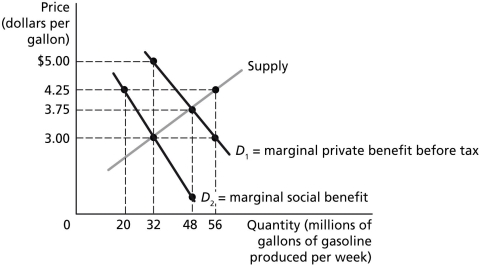
Figure 5-13 illustrates the market for gasoline before the government imposes a tax to bring about the efficient level of gasoline production.
-Refer to Figure 5-13.The market equilibrium quantity of gasoline is ________ million gallons per month.
A) 20
B) 32
C) 48
D) 56
Correct Answer:

Verified
Correct Answer:
Verified
Q189: Which of the following conditions holds in
Q190: Which of the following is an example
Q191: Figure 5-3<br> <img src="https://d2lvgg3v3hfg70.cloudfront.net/TB4193/.jpg" alt="Figure 5-3
Q192: A modern example of the tragedy of
Q193: Figure 5-16<br> <img src="https://d2lvgg3v3hfg70.cloudfront.net/TB4193/.jpg" alt="Figure 5-16
Q195: Figure 5-11<br> <img src="https://d2lvgg3v3hfg70.cloudfront.net/TB4193/.jpg" alt="Figure 5-11
Q196: When a tax on output is imposed
Q197: Figure 5-8<br> <img src="https://d2lvgg3v3hfg70.cloudfront.net/TB4193/.jpg" alt="Figure 5-8
Q198: Which of the following is an example
Q199: Which of the following exemplifies the tragedy