Multiple Choice
Figure 5-15
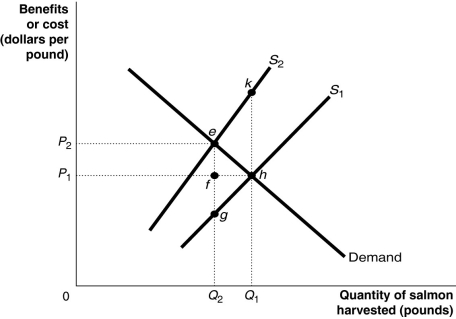
Figure 5-15 shows the market for Atlantic salmon, a common resource. The current market equilibrium output of Q₁ is not the economically efficient output. The economically efficient output is Q₂.
-Refer to Figure 5-15.The current market equilibrium output is partly the result of overfishing.In that case, what does S₁ represent?
A) the private marginal benefit of harvesting salmon
B) the social marginal benefit of harvesting salmon
C) the private marginal cost of harvesting salmon
D) the social marginal cost of harvesting salmon
Correct Answer:

Verified
Correct Answer:
Verified
Q90: One problem with using a command-and-control approach
Q91: How does a public good differ from
Q92: Figure 5-7<br> <img src="https://d2lvgg3v3hfg70.cloudfront.net/TB4193/.jpg" alt="Figure 5-7
Q93: A market supply curve reflects the<br>A)external costs
Q94: Which of the following is an example
Q96: Ronald Coase was awarded the 1991 Nobel
Q97: Which of the following displays these two
Q98: Which of the following displays these two
Q99: An externality is<br>A)a benefit realized by the
Q100: In economics, the term "free rider" refers