Multiple Choice
Figure 6-10
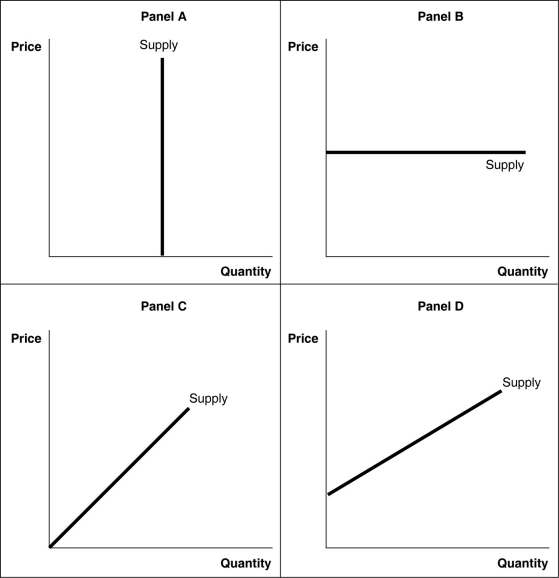
-Refer to Figure 6-10.The supply curve on which price elasticity changes at every point is shown in
A) Panel A.
B) Panel B.
C) Panel C.
D) Panel D.
Correct Answer:

Verified
Correct Answer:
Verified
Q177: Figure 6-4<br> <img src="https://d2lvgg3v3hfg70.cloudfront.net/TB4193/.jpg" alt="Figure 6-4
Q178: If the income elasticity for canned food
Q179: If the slope of a demand curve
Q180: Figure 6-8<br> <img src="https://d2lvgg3v3hfg70.cloudfront.net/TB4193/.jpg" alt="Figure 6-8
Q181: Which of the following statements is true?<br>A)If
Q183: Suppose that at a price of $55,
Q184: If the percentage increase in price is
Q185: Table 6-8<br> <img src="https://d2lvgg3v3hfg70.cloudfront.net/TB4193/.jpg" alt="Table 6-8
Q186: According to the Apply the Concept feature
Q187: Of the following, which is the best