Multiple Choice
Figure 6-12
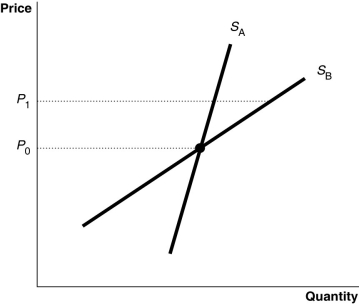
-Refer to Figure 6-12.Suppose the diagram shows the supply curves for a product in the short run and in the long run.Which supply curve represents supply in the short run and which curve represents supply in the long run?
A) SB represents supply in the short run and SA represents supply in the long run.
B) Either SA or SB could represent supply in the short run; in the long run the supply curve must be a vertical line.
C) Either SA or SB could represent supply in the long run; in the short run the supply curve must be a horizontal line.
D) SA represents supply in the short run and SB represents supply in the long run.
Correct Answer:

Verified
Correct Answer:
Verified
Q203: When Audrina raised the price of her
Q204: The price elasticity of supply for umbrellas
Q205: If at a price of $24, Octavia
Q206: The slope of a demand curve is
Q207: Which of the following statements about the
Q209: The paradox of American farming is<br>A)the demand
Q210: Assume that you own a small boutique
Q211: Figure 6-10<br> <img src="https://d2lvgg3v3hfg70.cloudfront.net/TB4193/.jpg" alt="Figure 6-10
Q212: Studies show that the income elasticity of
Q213: Figure 6-1<br> <img src="https://d2lvgg3v3hfg70.cloudfront.net/TB4193/.jpg" alt="Figure 6-1