Multiple Choice
Figure 6-12
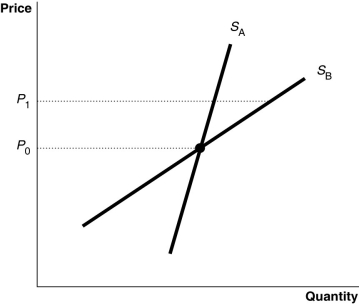
-Refer to Figure 6-12.The diagram shows two supply curves, SA and SB.As price rises from P₀ to P₁, which supply curve is more elastic?
A) SA
B) SB
C) They are equally inelastic.
D) They are equally elastic.
Correct Answer:

Verified
Correct Answer:
Verified
Q61: If firms do not increase their quantity
Q62: Assume that the market for barley is
Q63: During an economic expansion as consumer incomes
Q64: Holding everything else constant, the demand for
Q65: The price elasticity of supply is equal
Q67: Which of the following correctly comments on
Q68: Figure 6-11<br> <img src="https://d2lvgg3v3hfg70.cloudfront.net/TB4193/.jpg" alt="Figure 6-11
Q69: Ali's Gyros operates near a college campus.Ali
Q70: A perfectly elastic demand curve is<br>A)vertical.<br>B)horizontal.<br>C)curvilinear.<br>D)upward sloping.
Q71: A newspaper story on the effect of