Multiple Choice
Figure 9-1
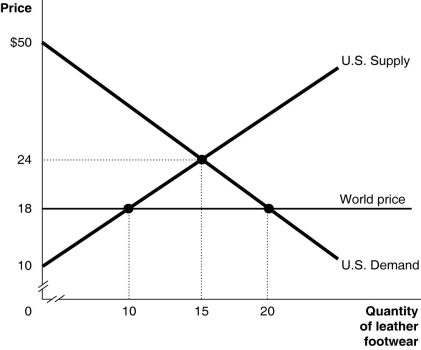
Figure 9-1 shows the U.S. demand and supply for leather footwear.
-Refer to Figure 9-1.Under autarky, the consumer surplus is
A) $195.
B) $260.
C) $300.
D) $555.
Correct Answer:

Verified
Correct Answer:
Verified
Q12: Table 9-6<br>Output per hour Production and Production<br>of
Q13: Once a country has a comparative advantage
Q14: Table 9-6<br>Output per hour Production and Production<br>of
Q15: Figure 9-2<br> <img src="https://d2lvgg3v3hfg70.cloudfront.net/TB4193/.jpg" alt="Figure 9-2
Q16: A tariff is a numerical limit on
Q18: _ raised average tariff rates by over
Q19: Table 9-1<br> <img src="https://d2lvgg3v3hfg70.cloudfront.net/TB4193/.jpg" alt="Table 9-1
Q20: Beginning in _, the government of China
Q21: The process of countries becoming more open
Q22: Figure 9-2<br> <img src="https://d2lvgg3v3hfg70.cloudfront.net/TB4193/.jpg" alt="Figure 9-2