Multiple Choice
Figure 9-1
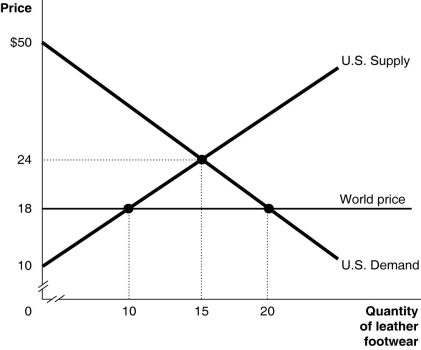
Figure 9-1 shows the U.S. demand and supply for leather footwear.
-Refer to Figure 9-1.Under autarky, the deadweight loss is
A) $0.
B) $15.
C) $30.
D) $40.
Correct Answer:

Verified
Correct Answer:
Verified
Q136: Table 9-1<br> <img src="https://d2lvgg3v3hfg70.cloudfront.net/TB4193/.jpg" alt="Table 9-1
Q137: How have U.S.imports and exports, as a
Q138: Measuring the impact of a quota or
Q139: Economists studying the effect of the China
Q140: Anti-globalization and protectionism are both arguments against
Q142: Which of the following statements is used
Q143: Figure 9-2<br> <img src="https://d2lvgg3v3hfg70.cloudfront.net/TB4193/.jpg" alt="Figure 9-2
Q144: Table 9-6<br>Output per hour Production and Production<br>of
Q145: The "Buy American" provision in the 2009
Q146: Jobs lost to foreign trade are generally