Multiple Choice
Figure 10-2
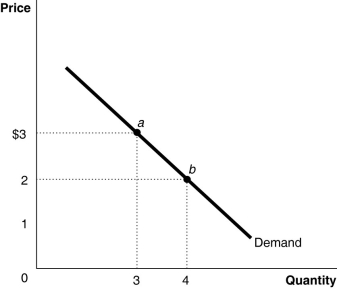
Figure 10-2 represents the demand for ice cream cones.
-Refer to Figure 10-2.Which of the following statements is true?
A) Points a and b are the utility-maximizing quantities of ice cream cones at two different prices of ice cream.
B) Points a and b may not necessarily be the utility-maximizing quantities of ice cream cones at two different prices because we have no information on the consumer's budget or the price of other goods.
C) Point a could be a utility-maximizing choice if the price is $3 but point b may not be because we have no information on the marginal utility per dollar when price changes.
D) Points a and b are derived independently of the utility-maximizing model.
Correct Answer:

Verified
Correct Answer:
Verified
Q142: Suppose your marginal utility from consuming the
Q143: If Joey Kobayashi experiences diminishing marginal utility
Q144: Consider a downward-sloping demand curve.When the price
Q145: Adhira buys chocolates and almonds.She has 3
Q146: _ is an experiment that tests the
Q148: Figure 10-10<br> <img src="https://d2lvgg3v3hfg70.cloudfront.net/TB4193/.jpg" alt="Figure 10-10
Q149: The additional utility that George receives from
Q150: Carolyn spends her income on popular magazines
Q151: In 2016, the most profit from the
Q152: If the price of muffins, a normal