Figure 10-7 the Above Panels Show Various Combinations of Indifference Curves and Combinations
Multiple Choice
Figure 10-7
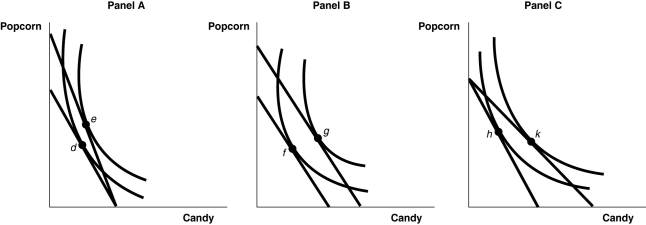
The above panels show various combinations of indifference curves and budget constraints for two products: Popcorn and Candy.
-Refer to Figure 10-7.Which diagram demonstrates an increase in total utility following a decrease in the price of popcorn?
A) the movement from d to e in Panel A
B) the movement from f to g in Panel B
C) the movement from h to k in Panel C
D) none of the above
Correct Answer:

Verified
Correct Answer:
Verified
Q44: Which of the following is not a
Q45: The income effect of a price change
Q46: Arnold Kim began blogging about Apple products
Q47: What is behavioral economics?<br>A)the study of how
Q48: Which of the following statements is false?<br>A)There
Q50: If Paul decides to buy a $60
Q51: Table 10-2<br> <img src="https://d2lvgg3v3hfg70.cloudfront.net/TB4193/.jpg" alt="Table 10-2
Q52: Which of the following refers to the
Q53: Table 10-7<br> <img src="https://d2lvgg3v3hfg70.cloudfront.net/TB4193/.jpg" alt="Table 10-7
Q54: Figure 10-7<br> <img src="https://d2lvgg3v3hfg70.cloudfront.net/TB4193/.jpg" alt="Figure 10-7