Multiple Choice
Figure 11-2
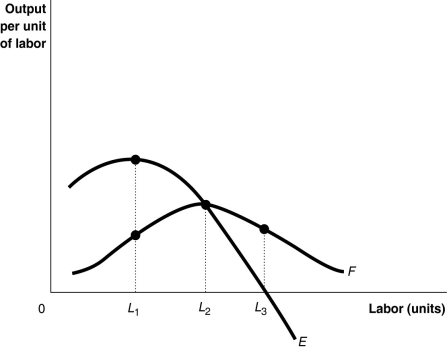
-Refer to Figure 11-2.The curve labeled "E" is
A) the total product curve.
B) the average product curve.
C) the marginal product curve.
D) the output supply curve.
Correct Answer:

Verified
Correct Answer:
Verified
Q104: If marginal product is greater than average
Q142: The shape of the average total cost
Q143: Figure 11-9<br> <img src="https://d2lvgg3v3hfg70.cloudfront.net/TB4193/.jpg" alt="Figure 11-9
Q144: Figure 11-10<br> <img src="https://d2lvgg3v3hfg70.cloudfront.net/TB4193/.jpg" alt="Figure 11-10
Q145: An isocost line shows<br>A)all the possible combinations
Q147: The total cost schedule shows the relationship
Q148: Which of the following is true at
Q149: If production displays diseconomies of scale, the
Q150: The slope of an isoquant measures<br>A)the price
Q151: Figure 11-2<br> <img src="https://d2lvgg3v3hfg70.cloudfront.net/TB4193/.jpg" alt="Figure 11-2