Essay
Table 11-4
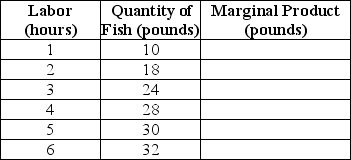
-Refer to Table 11-4.The table above shows the following relationship between hours spent fishing and the quantity of fish caught for Juan, a commercial fisherman.
a.Complete the Marginal Product column in Table 11-4.
b.Characterize the production function, i.e.does the production function display increasing marginal returns, diminishing marginal returns, etc.
c.Using the data above, graph Juan's marginal product curve.Be sure to label the horizontal and vertical axes.Is your graph consistent with your answer to part (b)? Explain.
d.Juan uses the following inputs for fishing - a small wooden boat (B), a fishing pole (P)and of course, his labor (L).Treating the boat and the fishing pole as fixed inputs and using the data above, graph Juan's Total Product of Labor curve.Be sure to label the horizontal and vertical axes.
e.The opportunity cost of Juan's time is $8 per hour.If Juan receives $2 per pound for his fish, what is the optimal number of hours he should spend fishing? Explain how you arrived at your answer.Hint: Recall marginal benefit and marginal cost analysis.
Correct Answer:

Verified
a. 
b.The production displays diminishi...View Answer
Unlock this answer now
Get Access to more Verified Answers free of charge
Correct Answer:
Verified
b.The production displays diminishi...
View Answer
Unlock this answer now
Get Access to more Verified Answers free of charge
Q282: The slope of an isocost line determines
Q283: Average total cost is<br>A)total cost divided by
Q284: Consider a manufacturing operation that uses specialized
Q285: Minimum efficient scale is defined as the
Q286: Firms in different countries that face different
Q288: Accounting costs exclude implicit costs.
Q289: The division of labor and specialization explain<br>A)why,
Q290: Table 11-2<br> <img src="https://d2lvgg3v3hfg70.cloudfront.net/TB4193/.jpg" alt="Table 11-2
Q291: Figure 11-6<br> <img src="https://d2lvgg3v3hfg70.cloudfront.net/TB4193/.jpg" alt="Figure 11-6
Q292: If the 15th unit of output has