Multiple Choice
Figure 11-7
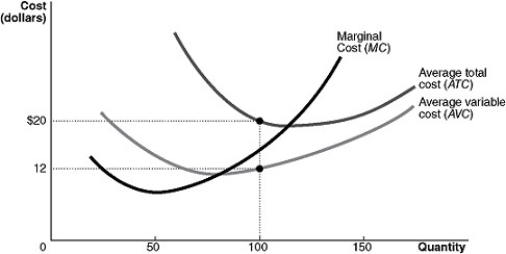
Figure 11-7 shows the cost structure for a firm.
-Refer to Figure 11-7.When the output level is 100 units, average fixed cost is
A) $12.
B) $8.
C) $4.
D) This cannot be determined from the diagram.
Correct Answer:

Verified
Correct Answer:
Verified
Q189: State the law of diminishing marginal returns.
Q191: If a firm produces 20 units of
Q192: Gertrude Stork's Chocolate Shoppe normally employs 4
Q193: If we have information about workers' marginal
Q195: Which of the following statements correctly describes
Q196: Diseconomies of scale occur when<br>A)long-run average costs
Q197: Table 11-7<br> <img src="https://d2lvgg3v3hfg70.cloudfront.net/TB4193/.jpg" alt="Table 11-7
Q198: Which of the following statements is true?<br>A)As
Q199: Average total cost is equal to average
Q207: In the long run, all of a