Multiple Choice
Figure 11-11
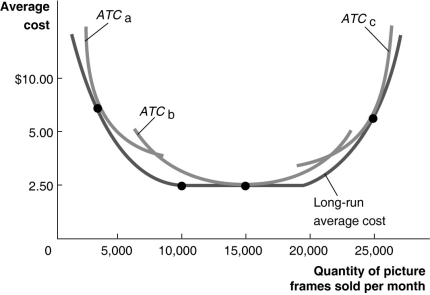
Figure 11-11 illustrates the long-run average cost curve for a firm that produces picture frames. The graph also includes short-run average cost curves for three firm sizes: ATCₐ, ATCb and ATCc.
-Refer to Figure 11-11.For output rates greater than 20,000 picture frames per month,
A) the firm will not make a profit because the average cost of production will be too high.
B) the firm will experience diseconomies of scale.
C) the firm will experience diminishing returns.
D) the short-run average total cost will equal the long-run average total cost of production.
Correct Answer:

Verified
Correct Answer:
Verified
Q1: Describe the difference between technology and positive
Q2: Economies of scale occur when<br>A)a firm's long-run
Q3: Table 11-1<br> <img src="https://d2lvgg3v3hfg70.cloudfront.net/TB4193/.jpg" alt="Table 11-1
Q5: An avocado orchard employs five full-time workers.Currently,
Q6: In economics, technology only refers to the
Q7: Which of the following are implicit costs
Q8: If, after hiring the 6th worker, a
Q9: Stan owns a software design business.He obtained
Q10: Figure 11-1<br> <img src="https://d2lvgg3v3hfg70.cloudfront.net/TB4193/.jpg" alt="Figure 11-1
Q11: As output increases, average fixed cost gets