Multiple Choice
Figure 11-11
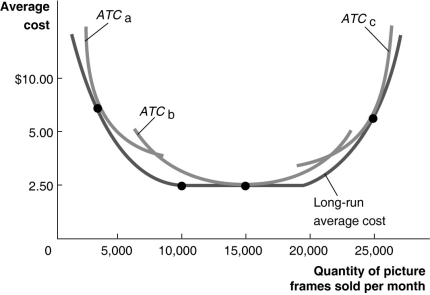
Figure 11-11 illustrates the long-run average cost curve for a firm that produces picture frames. The graph also includes short-run average cost curves for three firm sizes: ATCₐ, ATCb and ATCc.
-Refer to Figure 11-11.Constant returns to scale
A) occur for output rates greater than 5,000 picture frames.
B) occur between 5,000 and 20,000 picture frames per month.
C) occur between 10,000 and 20,000 pictures frames per month.
D) will shift the long-run average cost curve downward.
Correct Answer:

Verified
Correct Answer:
Verified
Q148: Which of the following is true at
Q149: If production displays diseconomies of scale, the
Q150: The slope of an isoquant measures<br>A)the price
Q151: Figure 11-2<br> <img src="https://d2lvgg3v3hfg70.cloudfront.net/TB4193/.jpg" alt="Figure 11-2
Q152: Adam spent $10,000 on new equipment for
Q154: If a firm experiences diminishing returns its
Q155: Table 11-6<br> <img src="https://d2lvgg3v3hfg70.cloudfront.net/TB4193/.jpg" alt="Table 11-6
Q156: To improve delivery, Joe's Pizza Emporium made
Q157: The basic activity of a firm is<br>A)to
Q158: Figure 11-1<br> <img src="https://d2lvgg3v3hfg70.cloudfront.net/TB4193/.jpg" alt="Figure 11-1