Multiple Choice
Figure 11-11
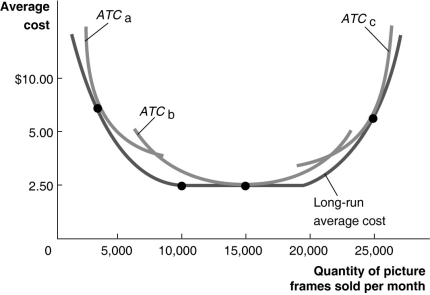
Figure 11-11 illustrates the long-run average cost curve for a firm that produces picture frames. The graph also includes short-run average cost curves for three firm sizes: ATCₐ, ATCb and ATCc.
-Refer to Figure 11-11.In the short run, if the firm sells fewer than 5,000 picture frames per month,
A) it should produce with the scale of operation associated with ATCₐ.
B) it should produce with the scale of operation associated with ATCb.
C) it should produce with the scale of operation associated with ATCc.
D) it will experience constant returns to scale.
Correct Answer:

Verified
Correct Answer:
Verified
Q73: Table 11-1<br> <img src="https://d2lvgg3v3hfg70.cloudfront.net/TB4193/.jpg" alt="Table 11-1
Q74: If diminishing marginal returns have already set
Q75: If four workers can produce 18 chairs
Q76: If, when a firm doubles all its
Q77: The rules of accounting generally require that
Q79: If average total cost is $50 and
Q80: Figure 11-13<br> <img src="https://d2lvgg3v3hfg70.cloudfront.net/TB4193/.jpg" alt="Figure 11-13
Q81: If a firm's long-run average total curve
Q82: Assume that you observe the long-run average
Q83: Which of the following is the best