Multiple Choice
Figure 11-14
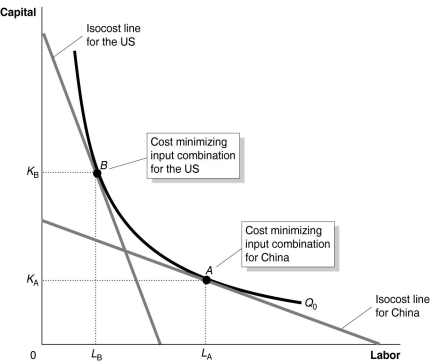
Figure 11-14 shows the optimal input combinations for the production of a given quantity of cotton in the United States and in China.
-Refer to Figure 11-14.Which of the following could explain why the United States and China use different input combinations to produce a given quantity of cotton and yet, each country produces that quantity at the lowest possible cost?
A) because the prices of inputs are not the same for the two countries: labor is relatively lower-priced and capital is relatively higher priced in the United States
B) because the prices of inputs are not the same for the two countries: labor is relatively lower-priced and capital is relatively higher priced in China
C) because the United States has more sophisticated technology and therefore is more efficient in cotton production
D) because the marginal product per dollar spent on capital yields a higher return in the United States than in China
Correct Answer:

Verified
Correct Answer:
Verified
Q234: Suppose the total cost of producing 40,000
Q235: Vipsana's Gyros House sells gyros.The cost of
Q236: Consider a firm that uses two inputs,
Q237: Table 11-3<br> <img src="https://d2lvgg3v3hfg70.cloudfront.net/TB4193/.jpg" alt="Table 11-3
Q238: In a diagram showing the average total
Q240: Figure 11-5<br> <img src="https://d2lvgg3v3hfg70.cloudfront.net/TB4193/.jpg" alt="Figure 11-5
Q241: Article Summary<br>Due to changing shopping habits and
Q242: If 11 workers can produce a total
Q243: The absolute value of the slope of
Q244: Table 11-7<br> <img src="https://d2lvgg3v3hfg70.cloudfront.net/TB4193/.jpg" alt="Table 11-7