Multiple Choice
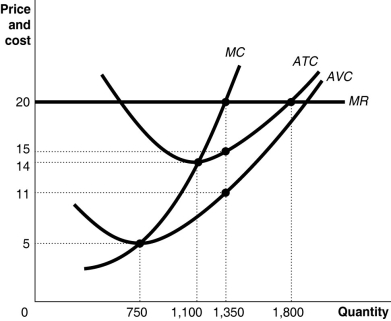
Figure 12-5

Figure 12-5 shows cost and demand curves facing a typical firm in a constant-cost, perfectly competitive industry.
-Refer to Figure 12-5.If the market price is $20, what is the average profit at the profit-maximizing quantity?
A) $5
B) $6
C) $9
D) $20
Correct Answer:

Verified
Correct Answer:
Verified
Q220: Firms in perfect competition produce the productively
Q221: All of the following can be used
Q222: To maximize profit, a firm will produce
Q223: Figure 12-18<br> <img src="https://d2lvgg3v3hfg70.cloudfront.net/TB4193/.jpg" alt="Figure 12-18
Q224: The minimum point on the average variable
Q226: Which of the following describes a difference
Q227: Figure 12-4<br> <img src="https://d2lvgg3v3hfg70.cloudfront.net/TB4193/.jpg" alt="Figure 12-4
Q228: Figure 12-13<br> <img src="https://d2lvgg3v3hfg70.cloudfront.net/TB4193/.jpg" alt="Figure 12-13
Q229: Which of the following is not an
Q230: Molly Sharp is producing a documentary about