Multiple Choice
Figure 12-6
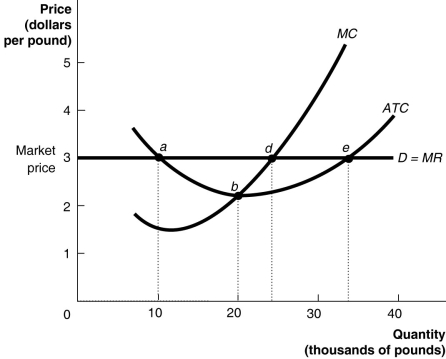
Figure 12-6 shows the demand, marginal cost (MC) and average total cost (ATC) curves for Jason's House of Apples.
-Refer to Figure 12-6.Jason is currently producing 20 thousand pounds of apples.To maximize his profit Jason should
A) keep production at 20 thousand pounds.
B) increase production to the output level indicated by point d.
C) increase production to the output level indicated by point e.
D) decrease production to the output level indicated by point a.
Correct Answer:

Verified
Correct Answer:
Verified
Q198: Which of the following is not a
Q199: A very large number of small sellers
Q200: Figure 12-1<br> <img src="https://d2lvgg3v3hfg70.cloudfront.net/TB4193/.jpg" alt="Figure 12-1
Q201: Figure 12-5<br> <img src="https://d2lvgg3v3hfg70.cloudfront.net/TB4193/.jpg" alt="Figure 12-5
Q202: Which of the following is a characteristic
Q204: The demand curve for each seller's product
Q205: If a perfectly competitive firm's price is
Q206: Figure 12-19<br> <img src="https://d2lvgg3v3hfg70.cloudfront.net/TB4193/.jpg" alt="Figure 12-19
Q207: Use a graph to show the demand,
Q208: Suppose Veronica sells teapots in the perfectly