Multiple Choice
Figure 12-9
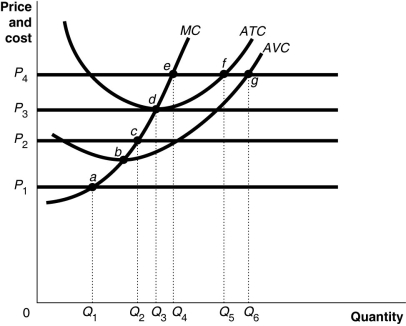
Figure 12-9 shows cost and demand curves facing a profit-maximizing, perfectly competitive firm.
-Refer to Figure 12-9.At price P₂, the firm would
A) lose an amount equal to its fixed cost.
B) lose an amount more than fixed cost.
C) lose an amount less than fixed cost.
D) break even.
Correct Answer:

Verified
Correct Answer:
Verified
Q13: Firms in perfectly competitive industries are unable
Q14: Figure 12-2<br> <img src="https://d2lvgg3v3hfg70.cloudfront.net/TB4193/.jpg" alt="Figure 12-2
Q15: For a firm in a perfectly competitive
Q16: In August 2008, Ethan Nicholas developed the
Q17: Which of the following is not a
Q19: The price of a seller's product in
Q20: Figure 12-2<br> <img src="https://d2lvgg3v3hfg70.cloudfront.net/TB4193/.jpg" alt="Figure 12-2
Q21: An individual seller in perfect competition will
Q22: Table 12-1<br> <img src="https://d2lvgg3v3hfg70.cloudfront.net/TB4193/.jpg" alt="Table 12-1
Q23: Assuming a market price of $4, fill