Multiple Choice
Figure 12-9
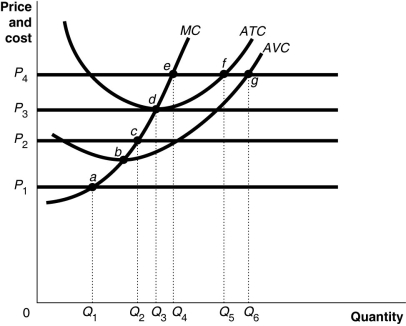
Figure 12-9 shows cost and demand curves facing a profit-maximizing, perfectly competitive firm.
-Refer to Figure 12-9.At price P₃, the firm would produce
A) Q₂ units
B) Q₃ units.
C) Q₄ units.
D) Q₅ units.
Correct Answer:

Verified
Correct Answer:
Verified
Q75: A perfectly competitive firm's supply curve is
Q76: Figure 12-2<br> <img src="https://d2lvgg3v3hfg70.cloudfront.net/TB4193/.jpg" alt="Figure 12-2
Q77: In a graph that illustrates a perfectly
Q78: Suppose Veronica sells teapots in the perfectly
Q79: Table 12-3<br> <img src="https://d2lvgg3v3hfg70.cloudfront.net/TB4193/.jpg" alt="Table 12-3
Q81: Figure 12-5<br> <img src="https://d2lvgg3v3hfg70.cloudfront.net/TB4193/.jpg" alt="Figure 12-5
Q82: If a firm in a perfectly competitive
Q83: If a firm's total variable cost exceeds
Q84: In a decreasing-cost industry, the entry of
Q85: Which of the following is a characteristic