Multiple Choice
Figure 12-12
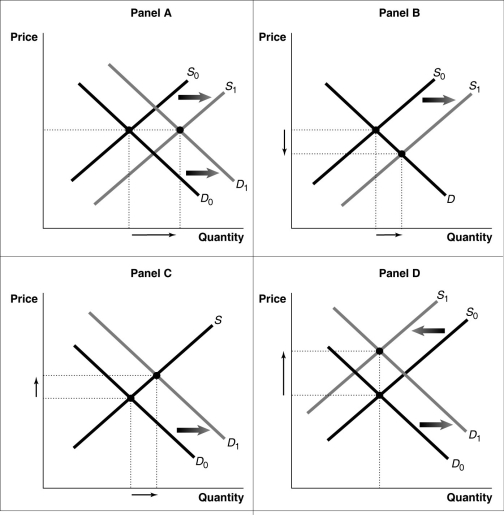
-Refer to Figure 12-12.Consider a typical firm in a perfectly competitive industry that makes short-run profits.Which of the diagrams in the figure shows the effect on the industry as it transitions to a long-run equilibrium?
A) Panel A
B) Panel B
C) Panel C
D) Panel D
Correct Answer:

Verified
Correct Answer:
Verified
Q179: Figure 12-15<br> <img src="https://d2lvgg3v3hfg70.cloudfront.net/TB4193/.jpg" alt="Figure 12-15
Q180: Apple introduced its iPhone 3G in July
Q181: What is the relationship among the following
Q182: If the market price is $40, the
Q183: Figure 12-5<br> <img src="https://d2lvgg3v3hfg70.cloudfront.net/TB4193/.jpg" alt="Figure 12-5
Q185: Assume that the market for cage-free eggs
Q186: Figure 12-4<br> <img src="https://d2lvgg3v3hfg70.cloudfront.net/TB4193/.jpg" alt="Figure 12-4
Q187: Figure 12-1<br> <img src="https://d2lvgg3v3hfg70.cloudfront.net/TB4193/.jpg" alt="Figure 12-1
Q188: In the long run, perfectly competitive firms
Q189: Figure 12-1<br> <img src="https://d2lvgg3v3hfg70.cloudfront.net/TB4193/.jpg" alt="Figure 12-1