Multiple Choice
Figure 12-14
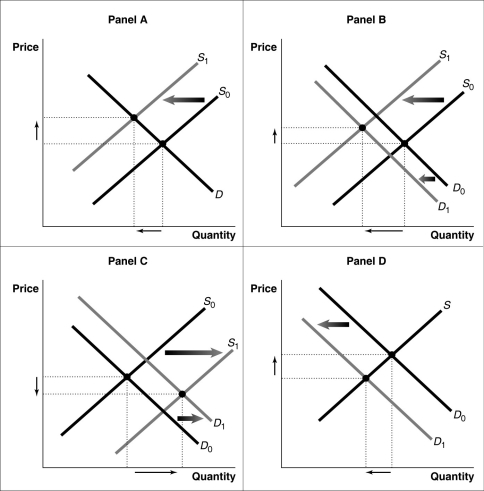
-Refer to Figure 12-14.Consider a typical firm in a perfectly competitive industry which is incurring short-run losses.Which of the diagrams in the figure shows the effect on the industry as it transitions to a long-run equilibrium?
A) Panel A
B) Panel B
C) Panel C
D) Panel D
Correct Answer:

Verified
Correct Answer:
Verified
Q204: The demand curve for each seller's product
Q205: If a perfectly competitive firm's price is
Q206: Figure 12-19<br> <img src="https://d2lvgg3v3hfg70.cloudfront.net/TB4193/.jpg" alt="Figure 12-19
Q207: Use a graph to show the demand,
Q208: Suppose Veronica sells teapots in the perfectly
Q210: In early 2007, Pioneer and JVC, two
Q211: A perfectly competitive firm in a constant-cost
Q212: If, for a given output level, a
Q213: Figure 12-10<br> <img src="https://d2lvgg3v3hfg70.cloudfront.net/TB4193/.jpg" alt="Figure 12-10
Q214: If a perfectly competitive firm's total revenue