Multiple Choice
Figure 12-17
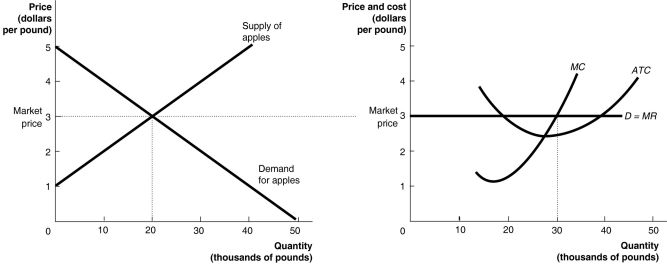
The graphs in Figure 12-17 represent the perfectly competitive market demand and supply curves for the apple industry and demand and cost curves for a typical firm in the industry.
-Refer to Figure 12-17.Which of the following statements is true?
A) The current market price is $3 but the firm will be able to increase the price in the future.
B) The current market price is $3 but the price will fall in the long run as a result of a decrease in demand.
C) The current market price is $3 but the price will fall in the long run as new firms enter the market.
D) The current market price is $3 but the price will increase in the future as the market demand increases.
Correct Answer:

Verified
Correct Answer:
Verified
Q231: Table 12-1<br> <img src="https://d2lvgg3v3hfg70.cloudfront.net/TB4193/.jpg" alt="Table 12-1
Q232: If a perfectly competitive firm achieves productive
Q233: Suppose the equilibrium price in a perfectly
Q234: At the profit-maximizing level of output for
Q235: The minimum point on the average variable
Q237: Figure 12-11<br> <img src="https://d2lvgg3v3hfg70.cloudfront.net/TB4193/.jpg" alt="Figure 12-11
Q238: Which of the following is the best
Q239: A perfectly competitive firm will maximize its
Q240: Figure 12-16<br> <img src="https://d2lvgg3v3hfg70.cloudfront.net/TB4193/.jpg" alt="Figure 12-16
Q241: A perfectly competitive industry achieves allocative efficiency