Multiple Choice
Figure 12-17
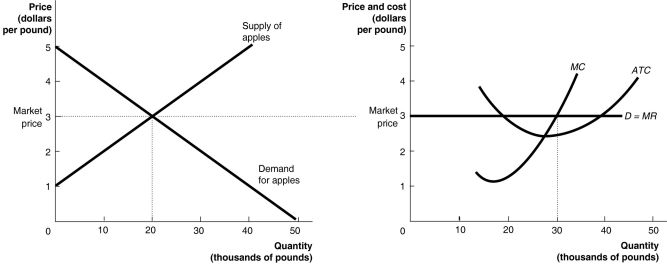
The graphs in Figure 12-17 represent the perfectly competitive market demand and supply curves for the apple industry and demand and cost curves for a typical firm in the industry.
-Refer to Figure 12-17.Which of the following statements is true?
A) The firm will produce 30 thousand pounds of apples in the short run and earn an economic profit. New firms will enter the market and shift the market supply curve to the left.
B) The firm will produce 30 thousand pounds of apples in the short run and earn an economic profit, but it would earn a greater profit if it produced at the lowest point on the ATC curve.
C) The firm will produce 30 thousand pounds of apples in the short run and earn an economic profit. New firms will enter the industry; as a result, the firm will be forced to exit the industry in the long run.
D) The firm will produce 30 thousand pounds of apples in the short run and earn an economic profit. In the long run the firm will break even.
Correct Answer:

Verified
Correct Answer:
Verified
Q285: Profit is the difference between<br>A)marginal revenue and
Q286: A firm would decide to shut down
Q287: What is a long-run supply curve? What
Q288: Maximizing average profit is equivalent to maximizing
Q289: Assume that price is greater than average
Q291: A firm will make a profit when<br>A)P
Q292: Table 12-4<br> <img src="https://d2lvgg3v3hfg70.cloudfront.net/TB4193/.jpg" alt="Table 12-4
Q293: Figure 12-9<br> <img src="https://d2lvgg3v3hfg70.cloudfront.net/TB4193/.jpg" alt="Figure 12-9
Q294: Figure 12-9<br> <img src="https://d2lvgg3v3hfg70.cloudfront.net/TB4193/.jpg" alt="Figure 12-9
Q295: Figure 12-5<br> <img src="https://d2lvgg3v3hfg70.cloudfront.net/TB4193/.jpg" alt="Figure 12-5